
Due to the Corona virus pandemic of 2020, my presentation for the Chicago chapter Institute of Internal Auditors (IIA) 60th Annual Seminar was cancelled. It was an honor to have my proposal selected and I hope to have many more opportunities to speak about data analytics in the future. In the meantime, and amidst the chaos, I figured I could at least share the knowledge contained in my presentation here!
Having been an IT internal auditor for the past two years, I have attended many seminars and training workshops throughout the Chicagoland area. A key trend I noticed beginning in 2018 was how many people were starting to talk about data analytics in the realm of audit. I found this very interesting as I had just shifted my career from IT and software development to IT auditing. Fast forward two years later and I have developed over 50 analytics projects and 100’s of scripts. These projects range from analyzing millions of employee expense transactions to developing strategic metrics from more than $2 billion in accounts payables. I have also automated the control testing and sampling processes in the general IT control (ITGC) environment for change management, user access reviews and provisioning, employee terminations, etc. and used analytics to support observations for numerous operational audits.
Throughout my data analytics journey, I have found that most presentations given at audit seminars and training workshops do not go beyond the initial stages of building and gaining support for data analytics programs. Everyone knows you need management’s support, the right tools, and the right employees. You can easily find articles proclaiming the “Top 25 Analytics for every Organization” online and many of the analytics software vendors have active communities and provide an abundance of materials and support. With all of this in mind, I wanted to focus my presentation on what happens once you have an analytics program in place. How do you continue to grow the program and what are some innovative ways for beefing up the value-add factor? I wanted to share the most important lessons learned but mainly engage the audience, challenge their thinking, and spark new ideas for them to leave with and hopefully implement.
Agenda
- Data analytics in the context of audit
- Practicing good data hygiene
- Interrogation tools and techniques
- Visualizations – Don’t lose the value!
- Lessons learned
Learning Objectives
- Develop and deploy data interrogation techniques
- Add value by analyzing decentralized data sets
- Tell stories and visualize results effectively
- Apply lessons learned from developing data analytics programs
“What gets measured, gets managed.” – Peter F. Drucker, American Economist and Author
Data Analytics Meets Audit
How do we define data analytics as auditors?
- Data: A piece of information.
- Analytics: Discovering, interpreting, and communicating meaningful patterns in data.
In audit terms: Data analytics refers to discovering useful information and supporting decision-making through the process of extracting, cleansing, transforming, and visualizing data.
Prepping for Interrogation
Auditors may need basic knowledge of:
- Querying and manipulating data (SQL, Data Conversion)
- Cleaning and normalizing data (Errors, Duplication)
- Different data types (Structured vs. Unstructured)
- Establishing defined relationships between datasets (Keys and Joins)
Auditors should also be able to eliminate “noise,” visualize the data, understand correlation versus causation, and recognize when not to use data.
Focusing the Light
Use interrogation tactics to help determine the root cause of non-compliance, policy gaps, opportunities for enhancement, and where further investigation may be required.
Caution: Discuss the use of data analytics in relation to SOX testing with external auditors and be thorough in documenting procedures.
Developing Good Data Hygiene
The following items are useful techniques and common functions available in most analytics tools for normalizing data.
- Non-alphanumeric characters – REPLACE(), OMIT()
- Replace or remove characters, e.g., ” – ” and ” ‘ “
- Justification – ALLTRIM()
- Removes leading and trailing spaces from characters
- Varying lengths – SUBSTRING()
- Shorten or lengthen field lengths
- Leading zeros – ZONED()
- Converts numeric data to character data and adds leading zeros
- Varying decimal places – DECIMALS()
- Specifies the number of decimal places for a numerical field
Data Interrogation Tools
Data interrogation tools allow users to manipulate (interrogate) data without affecting the data’s integrity.
Basic Functions:
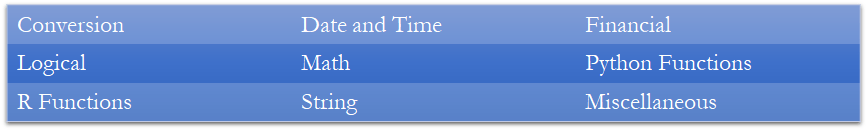
Additional Features:
Many analytics tools offer audit logging, scripting and graphical user interfaces (GUIs), and have database connector functionality.
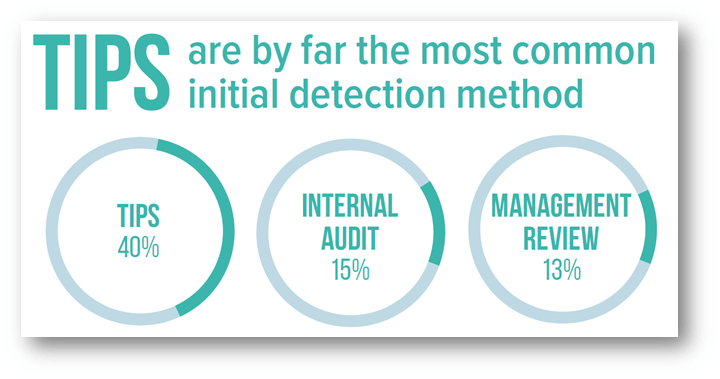
Finding the Fraud
It is important to note that data interrogation is not ALWAYS focused on identifying fraud. There are many other ways in which data interrogation techniques can be applied to support the audit function. As shown below, internal audit departments account for only 15% of fraud detection.
Cross-Examination
Distinguishing between two types of fraud:
- On the books – Easier to identify; it is in your data!
- Control: Bidding process, etc.
- Off the books – Almost impossible to identify
- Controls can be circumvented (under the table payments, etc.)
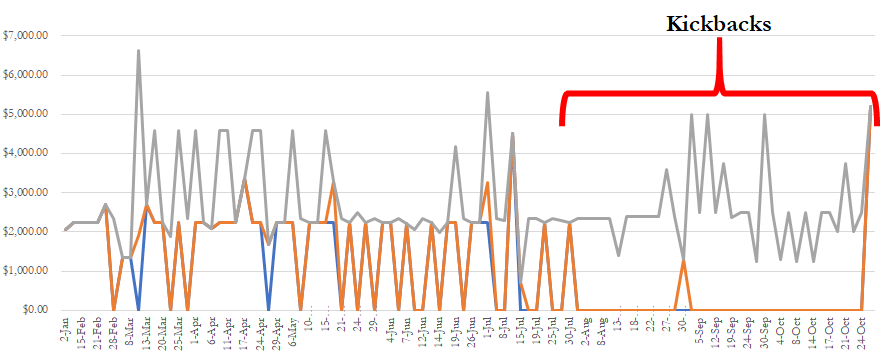
Data analytics can be used to assess the risk of off the books activity and add value by providing management with data trends and historical analysis.
Simple but Effective…
Data Interrogation Techniques
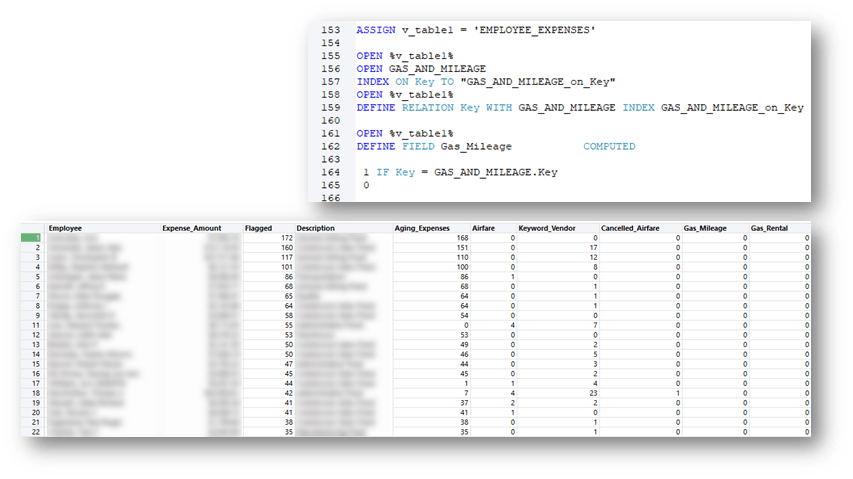
Iterating Through Data:
- RECOFFSET() – Returns a field value from a record that is a specified number of records away from the current record.
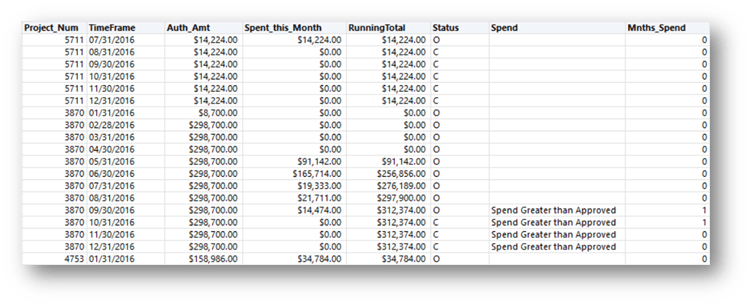
Scenario: Project Spending Review
Identify when and how long a project was over budget.
- Sort by project and ascending transaction date (oldest to newest)
- Condition: (RECOFFSET(P,1) = P) AND Running_Total > Auth_Amt
- Return Value: “Spend Greater than Approved”
Know Your Enemy:
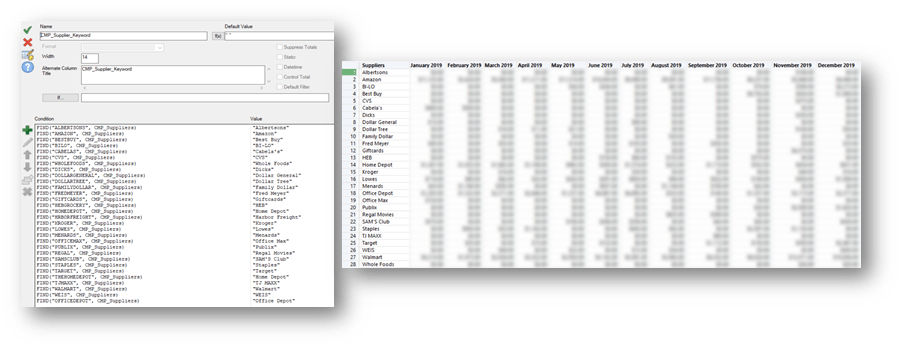
Scenario: Are we effectively monitoring gift card purchases?
- Create a list of known vendors who sell gift cards
- Look for round dollar amounts
- Cross-tab is your friend (better visualize results)
- Monitor and update
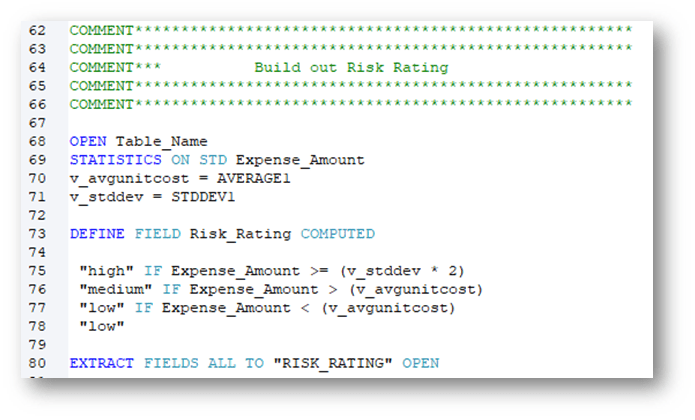
Assigning a Risk Rating:
Using the STATS() function:
- Define variables
- Assign values
- Perform analysis
- Extract results
Building a risk rating into analytics scripts increases value for defining risk and auditing. In my experience, applying a risk rating methodology to sampling and test lead to a 30% increase in testing efficiency.
The Law is on Your Side
Benford’s Law Analysis
Benford’s law is an observation about the leading digits of the numbers found in real-world data sets. Intuitively, one might expect that the leading digits of these numbers would be uniformly distributed so that each of the digits from 1 to 9 is equally likely to appear. It is often the case that 1 occurs more frequently than 2, 2 more frequently than 3, and so on.
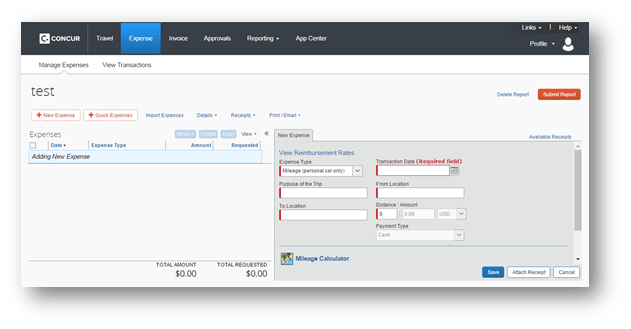
Scenario: T&E Expense Review – Looking for outliers
- Leading two digits – (LEADING(Expense_Amount, 2) = “xx”‘)
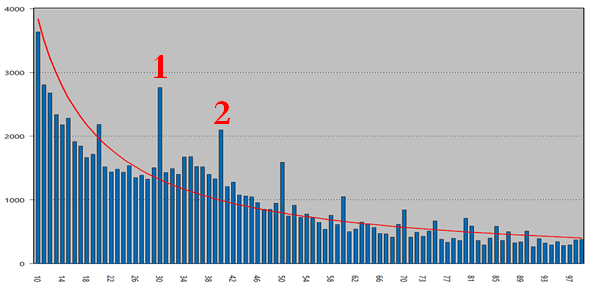
Expense Insights:
- Baggage/Change/Flight Fees (not airfare) = 27%
- Parking Fees and Tolls = 14%
What about the Report?
When implementing continuous monitoring, it is important to trend the results.
- Keep it simple
- Use unique record keys (primary keys)
- Cross-tab
Interrogating Decentralized Data
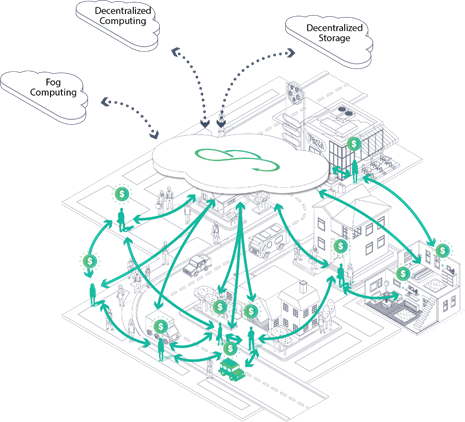
Overcome the Obstacles First
- Inconsistent data
- Duplicated data
- Varying data formats
- Data availability
Where is my Data Hiding?
- Compare the file directories of multiple locations.
- ITGC Application: Change Management
- Compare each application’s users to the termination list periodically
- ITGC Application: Terminations and Timeliness Review
- Compare user access across multiple applications and platforms
- ITGC Application: User Access Review
- Compare customer agreement terms across business segments
- Application: Enhanced Operational Review
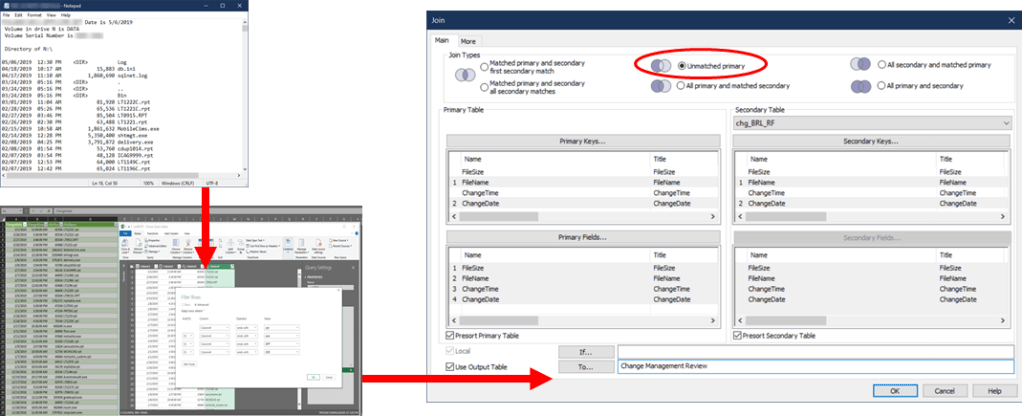
Interrogating Decentralized Data Continued
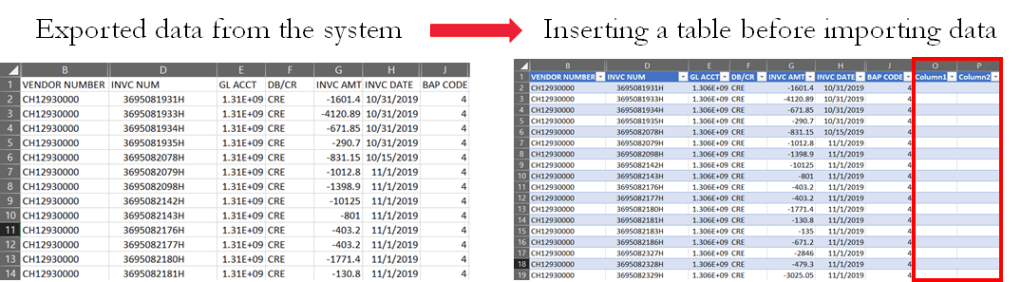
Below shows the process of taking a text file containing the directory contents of an application, resulting from a PowerShell script, and formatting the text file in Excel using the legacy text wizard. After performing our data hygiene steps, we then perform analysis using a data interrogation tool to review change management for the application files by comparing them to the files in the main production instance.
Interrogating Decentralized Data Continued
Fuzzy Logic and Levenshtein Distance
- Effective when analyzing inconsistent data
- Apply after normalization
- Can vary the level of accuracy of results
Ex: [FUZZYJOIN LEVDISTANCE DISTANCE 2]
- 1.1234MCCLENNANCTCOLUMBUSIN47002
- 1.1234MCCLENNANSCTCOLUMBUSIN47002
Flag the results: MATCH((UPPER(ALLTRIM(ADDRESS1))), (UPPER(ALLTRIM(ADDRESS2))) = F
Extracting the Value
Reflect and Assess
- Did I ask enough questions to understand the business process?
- Do my results make sense? (Did I involve process owners?)
- What is the most effective visual for my data and my audience?
- In what context should I present the results?
- Are my analytics repeatable?
- Are there actionable items from the results?
Telling the Story
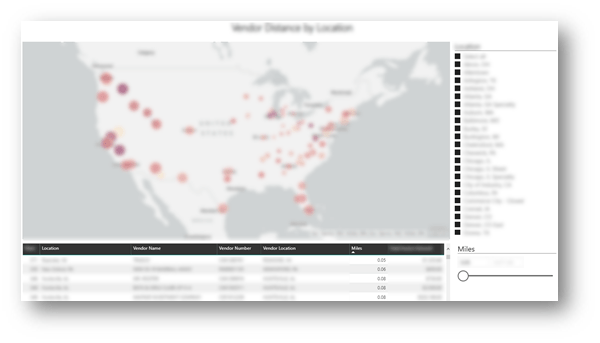
Incorporating External Datasets
Scenario: Can we improve the efficiency of vendor spending relative to our geographic locations?
Process:
- Map vendor master file addresses to latitude and longitude coordinates
- US Cities Latitude and Longitude Database – SimpleMaps
- Map company location addresses to latitude and longitude coordinates
- Calculate distances using the Great-Circle Distance formula in Excel
- Import into visualization tool
Creating Visualizations
There are many different visualization tools available. Microsoft PowerBI, Tableau, etc.
- Be a resource
- Give management a tool
- Plug and play with new data
- Approach from the value add standpoint
- Let others draw their own conclusions
Lessons Learned
- Ask questions about your data
- Verify the completeness and accuracy of your data
- Be as detailed as possible when requesting datasets
Do not Trust the System!
Live in Harmony
Bring together your data of varying file formats, naming conventions, and columns, and transform them into one cohesive dataset.
- Create common fields with the same length
- Pay attention to time and date formats
- Have a standard number of decimal places
- Track calculated and computed fields
Iterate, Iterate, Iterate
- Use scripts and macros
- Have a standard project template
- Use comments and version control
- Leverage reports
- Make the process repeatable

Conclusion
- Invest time in getting to know your data
- Use interrogation techniques to preserve data integrity
- Document and iterate
- Be skeptical
PCAOB – Data Technology – Task Force
- Assess whether there is a need for guidance, changes to PCAOB standards, or other regulatory actions in light of the increased use of data analytics and emerging technology-based tools by auditors and preparers. https://pcaobus.org/Standards/research-standard-setting-projects/Pages/data-technology.aspx
